 |
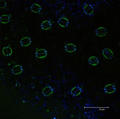
Average projection of the autofluorescence of Paeonia lactiflora |
|
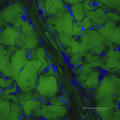 |
Single scan image of the autofluorescence of Paeonia lactiflora |
|
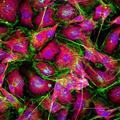 |
Maximum projection of B16 cells |
|
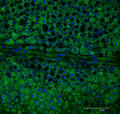 |
Series scan image of Hydrangea macrophylla leaf |
|
 |
Maximum projection of Hydrangea macrophylla fertile petal |
|
 |
Series scan image of Hydrangea macrophylla sterile petal |
|
 |
Single scan image of B16 cells |
|
 |
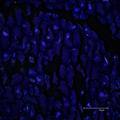
Single scan image of rat brain section |
|
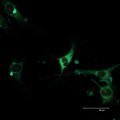 |
Single scan image of multinucleated B16 cell |
|
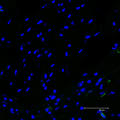 |
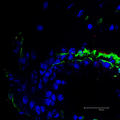
Single scan image of rat brain section |
|
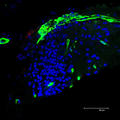 |
Single scan image of rat brain section |
|
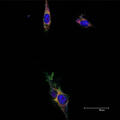 |
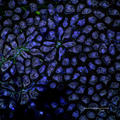
Single scan image of B16 cells |
|
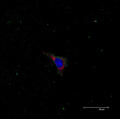 |
Maximum projection of a B16 cell |
|
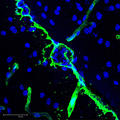 |
Maximum projection of a rat brain section |
|
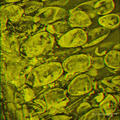 |
3D image of a Tsuga sieboldii (Hemlock) pine tree needle |
|
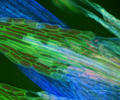 |
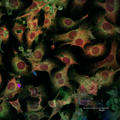
Average projection of B16 cells |
|
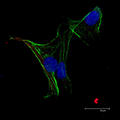 |
Single scan image of HT-22 cells |
|
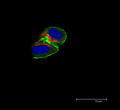 |
Maximum projection image of HT-22 cells |
|
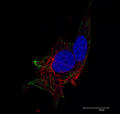 |
Single scan image of HT-22 cells |
|
